

We found that D3.js does not have a Gantt library. So we went ahead, created one and open sourced.
I’m super excited to write this article! Right from the day I jumped into data visualization and big data analytics D3 never failed to fascinate me. I’ve worked with plenty of charts in the recent years, and most of them are data rich. D3 is one of the powerful libraries with which you can build your own custom charts. Also D3 is driven by a powerful community that helps it grow even more bigger everyday - people around the world contribute their work which results in huge a example set.
For a long time I have wanted to open source one of our charts that we build at the SkcriptHQ and here I am.
This article is about an Interactive Gantt Chart library that we built internally and we’re open sourcing it for public use as of today.
Quick Overview
It’s an Interactive gantt chart library with multiple views for showing the gantt range and domain, features that helps you plot your timeline activities in a beautiful manner and interactive events that you’ll perform on a chart.
Here is how the gantt looks.

Initially I started with the simple task of plotting timelines in the graph domain, later when I saw that it was too plain I added a few more things like the colored mapping lines, on click event, domain to previous and next domain traversal, etc.
Setting Up
Just import the following libraries
- D3js (Version 3)
- MomentJS
- GanttChart
Configuration
Data
Use the above structure for defining the blocks.
The Views
The chart has five different views based on the starting and ending range of the domain.
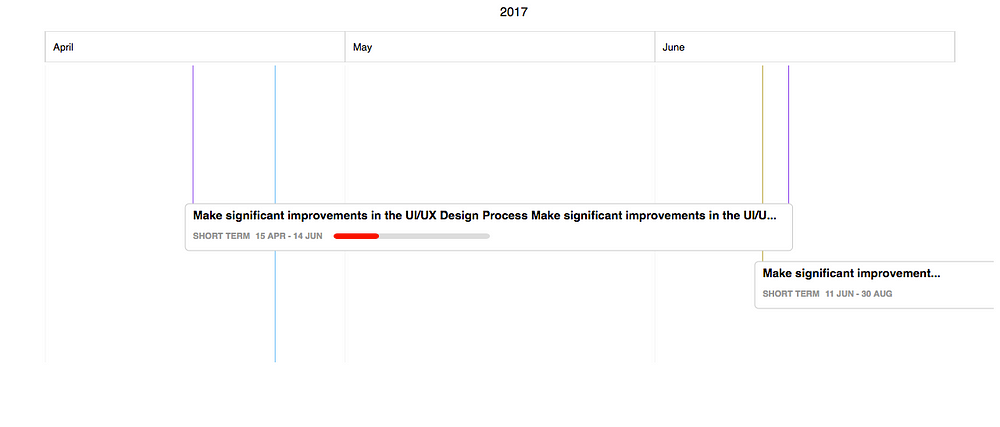
Quarterly/Halfyearly View
metrics: {type: "quarterly", months: ['January 2017','February 2017','March 2017']}
Here it covers two sets of months - it can either be for every 3 months of the year or for every 6
months of the year. It’s the most commonly used view in major tools like OKR
management tool.
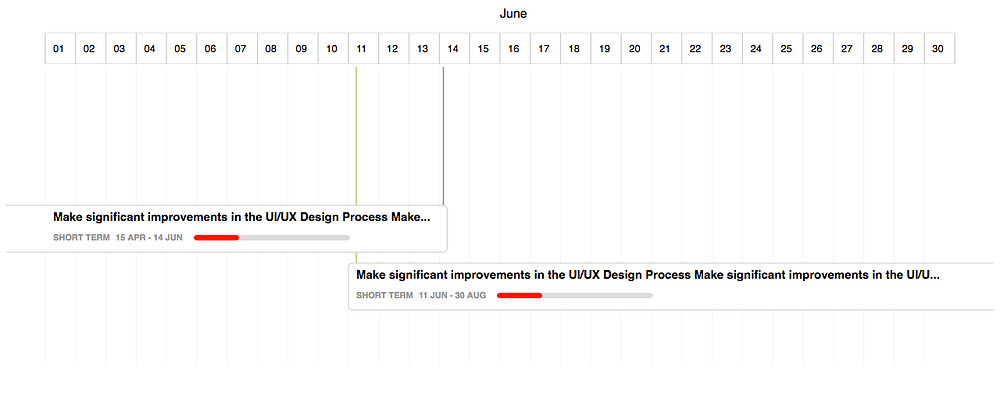
Monthly View
metrics: {type: "monthly", month: 'March 2017'}
When you want to see the blocks that are within a month we can use the monthly
view. Here, the secondary header is filled with each day of the month and the
first header shows the name of the month.
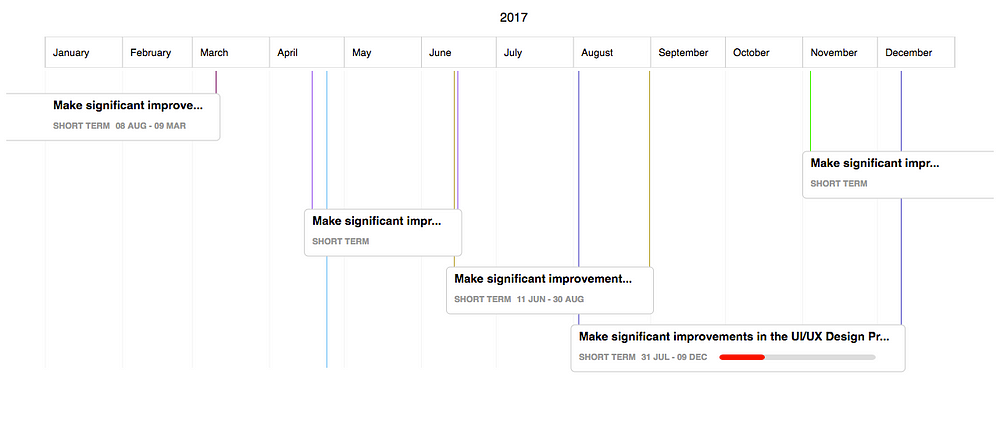
Yearly View
metrics: {type: "yearly", year: 2017}
As the name explains, it shows all the blocks that are assigned within the
range of a given year. Here, the secondary header shows each month of the year and
the primary header shows the whole year.
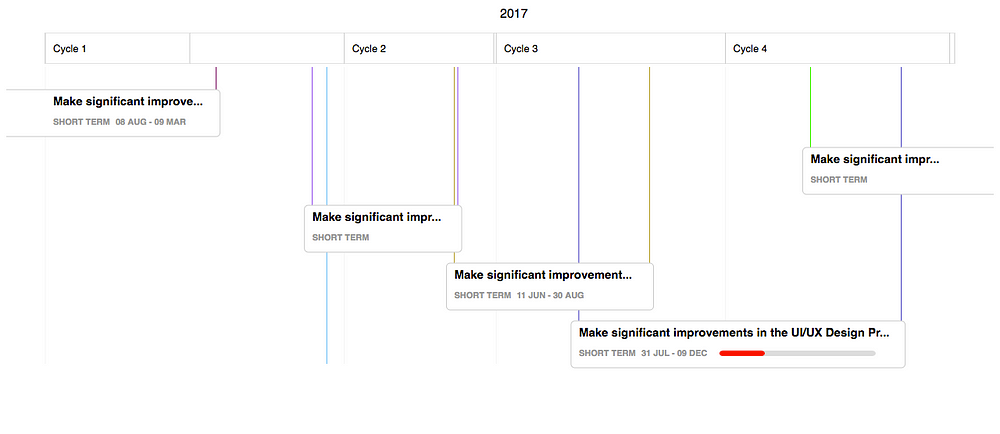
Sprint View
metrics: {type: "sprint", year: 2017, cycles: cycles},
This is similar to the yearly view, the only difference being the
months that are replaced with sprint cycles.
Cycles Data
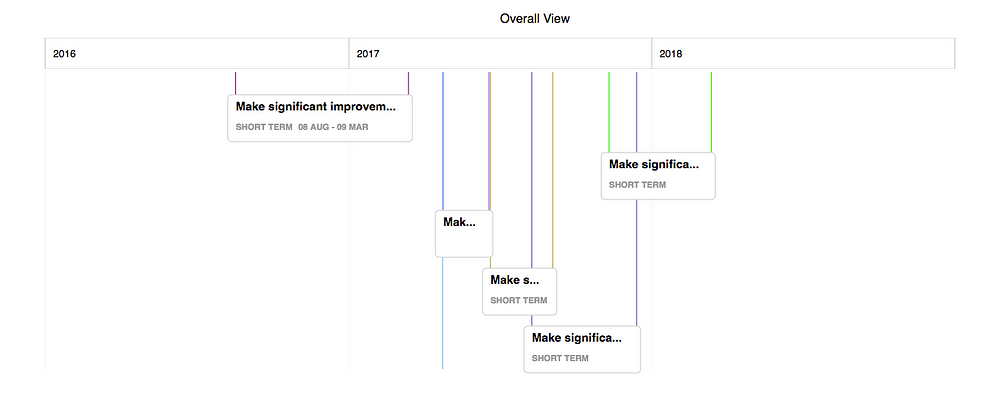
Overall View
metrics: {type: "overall", years: [2016, 2017, 2018]}
The overall view covers the domain of a given year as a range and here the years are
shown in the secondary header just to reduce the complexity.
Interactions
The chart comes with few interactions listed as follows.
Hover on a block
Click on a block
Traversal to next domain on clicking right and left of Chart
 Here is like live demo of the chart.
August Labs provides solutions for data visualization and big data analytics - for any solutions that you might require, reach out to us at business@skcript.com
Up next
This is by far the most beautiful travel illustration by Niemann